Welcome to the first post of the “Cornerstone Policy Research Blog.” Our goal is to use this blog to provide fact-based commentary on the numerous issues facing New Hampshire’s families. We hope you find it useful as we kick-off with a look at the state of marriage in New Hampshire.
Unfortunately, we all know that marriage is on the decline both nationally and in New Hampshire. One interesting way to measure this decline is to look at state-level tax return data from the Internal Revenue Service (IRS).
Why the IRS? Because it is some of the best data available to researchers since we are all required by law to comply—or else face criminal penalties. So, any trend that shows up in the IRS data is worth taking a good long look at.
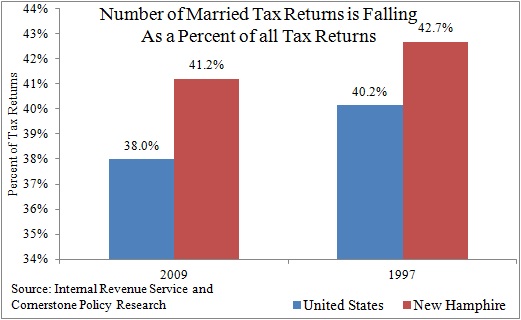
The chart below shows the percentage of tax returns that file under the “married filing jointly” tax status in 1997 and 2009. Nationally, married returns represented 40.2 percent of all tax returns in 1997. By 2009, the share of married returns had fallen by 5.4 percent to 38 percent.
Thankfully, marriage is holding up a bit better in New Hampshire than it is nationally. In New Hampshire, married returns represented 42.7 percent of all tax returns in 1997. By 2009, the share of married returns had fallen by 3.5 percent to 41.2 percent.
Overall, the good news is that New Hampshire has a higher percentage of married returns and the drop between 1997 and 2009 has been smaller than the national average. The bad news is that married returns are still mimicking the national downward trend.


